- Unity User Manual 2022.2
- 脚本
- 设置脚本编写环境
- Debug C# code in Unity
Debug C# code in Unity
You can use a debugger to inspect your source code while your application is running. Unity supports the following code editors to debug C# code:
- Visual Studio(包含 Visual Studio Tools for Unity 插件)
- Visual Studio for Mac
- Jetbrains Rider
- Visual Studio Code (experimental)
Although these code editors vary slightly in the debugging features they support, they all provide basic functionality such as break points, single stepping, and variable inspection. You can attach these code editors to the Unity Editor or Unity Player to debug your code.
Managed code debugging in Unity works on all platforms except WebGL. It works with both the Mono and IL2CPP scripting backends.
Configure the code editor
Visual Studio (Windows)
The Unity Editor installer includes an option to install Visual Studio with the Visual Studio Tools for Unity plug-in. This is the recommended way to set up Visual Studio for debugging with Unity.
If Visual Studio is already installed on your computer, open it and go to Tools > Get Tools and Features… to locate and install the Visual Studio Tools for Unity plug-in.
Visual Studio for Mac
Unity Editor 安装程序包括一个选项,允许安装 Visual Studio for Mac。建议通过这种方式设置 Visual Studio for Mac 以便在 Unity 中执行调试。
If Visual Studio for Mac is already installed on your computer, open it and go to Visual Studio > Extensions > Install from file… to locate and install the Visual Studio Tools for Unity plug-in.
JetBrains Rider
You can use the default installation of JetBrains Rider to debug code in Unity on Windows or Mac. Visit the JetBrains website to install it.
Visual Studio Code
To debug in Unity using Visual Studio Code, you need to install an extension. See Visual Studio Code’s documentation to configure Visual Studio Code as the code editor for your Unity project. Follow Visual Studio Code’s instructions specific to the Debugger for Unity extension to install it. Unity’s support for Visual Studio Code is experimental as Unity does not officially support the Debugger for Unity extension.
Specify the External Script Editor in Unity
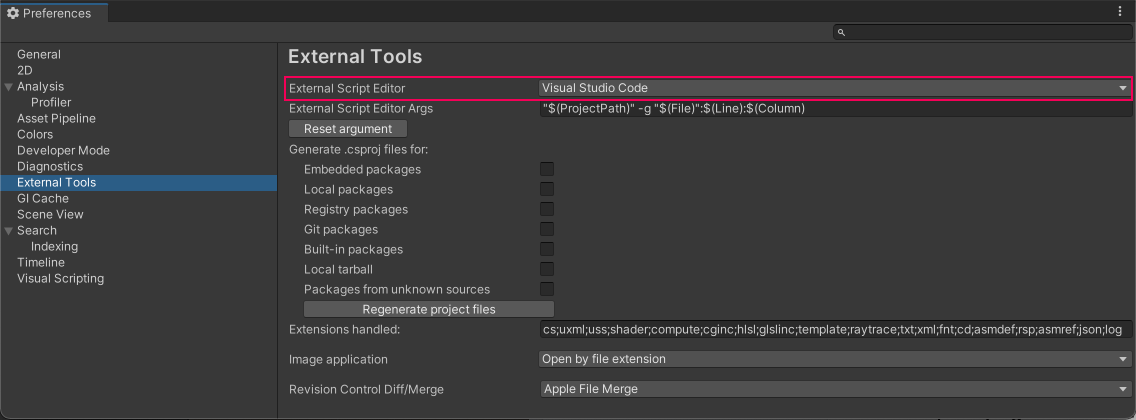
Once you’ve installed a code editor, open Unity, go to Preferences > External Tools and set the External Script Editor to your code editor.
Breakpoints
Breakpoints allow you to specify points in your code where you want to pause its execution. In your external code editor, you can set a breakpoint on a line of code where you want the debugger to stop. While the code editor is at a breakpoint, you can view the contents of variables step by step.
If you have attached your code editor to the Unity Editor (see Attach your code editor to the Unity Editor), the Unity Editor becomes unresponsive until you choose the continue option in your code editor, or stop debugging mode.
To see how you can set breakpoints in Visual Studio see Set breakpoints in Visual Studio.
Debug in the Unity Editor
You can debug C# code as it runs in the Unity Editor while the Unity Editor is in Play Mode.
To debug in the Editor, you need to set the Editor’s Code Optimization mode to Debug Mode, then you can attach a code editor with a debugging feature.
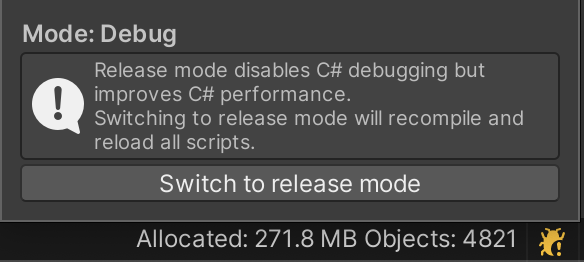
To change the Code Optimization mode, select the Debug Button in the bottom right of the Unity Editor Status Bar.

Unity’s Code Optimization setting has two modes:
- Debug Mode, which you can use to attach external debugger software, but gives slower C# performance when you run your Project in Play Mode in the Editor.
- Release Mode, which gives faster C# performance when you run your Project in Play Mode in the Editor, but you cannot attach any external debuggers.
When you click the Debug button in the status bar, a small pop-up window opens which contains a button you can use to switch modes. The window also displays information about the current mode, and describes what happens if you switch modes.
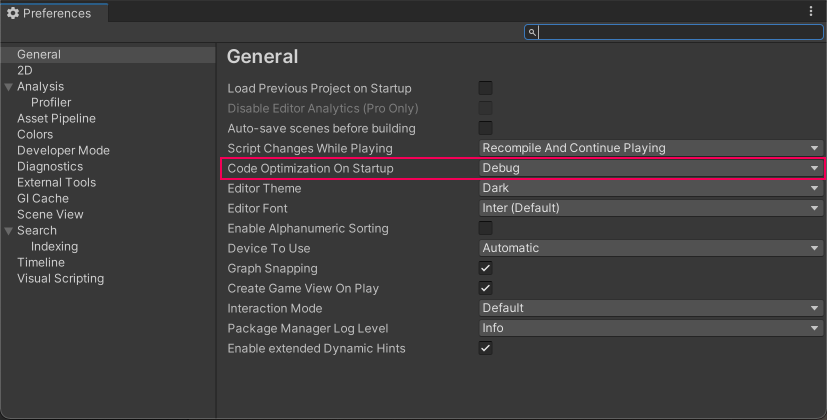
To change which mode the Unity Editor starts up in, go to Edit (macOS: Unity) > Preferences > General > Code Optimization On Startup.
To control these settings using a script, use the following API:
您还可以覆盖编辑器启动时的模式,或关闭调试器侦听套接字。为此,当您启动编辑器时请使用以下命令行参数:
-
-releaseCodeOptimization. Starts the Editor in Release code optimization mode. -
-debugCodeOptimization. Starts the Editor in Debug code optimization mode. -
-disableManagedDebugger. Starts the Editor with the debugger listen socket disabled.
Attach your code editor to the Unity Editor
The way to attach your code editor to the Unity Editor depends on what code editor you use, and is often a different option from your code editor’s normal debugging process. Some code editors allow you to select an instance of Unity to debug. For instructions specific to your code editor, see Code editor external documentation. To see how you can do this in Visual Studio, see Attach Visual Studio to the Unity Editor.
When you have attached the code editor to the Unity Editor and you are ready to begin debugging, return to the Unity Editor and enter Play Mode.
Debug in the Unity Player
To compile a Unity Player for you to debug:
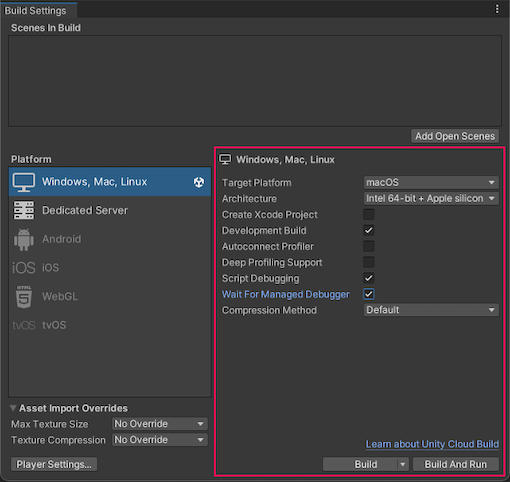
- Go to File > Build Settings.
- Enable the Development Build and Script Debugging options before you build the Player. You could also enable the Wait For Managed Debugger option to make the Player wait for a debugger to be attached before the Player executes any script code.
- Select Build And Run.
Attach your code editor to the Unity Player
To attach your code editor to the Unity Player, in your code editor, select the IP address (or machine name) and port of your Player. For an example of where to find this in Visual Studio, see Attach Visual Studio to the Unity Editor.
Note: Your code editor will show all instances of Unity that are available to debug. Make sure you attach the code editor to the correct instance of the Unity Player, and not to the Unity Editor if both are running.
When you have attached the debugger, you can begin debugging normally. For instructions on how to attach the Unity Player to your specific code editor, see Code editor external documentation. For an example of how to attach a Unity Player that runs on a mobile device to Visual Studio, see Debug Android and iOS devices with Visual Studio.
Set breakpoints in Visual Studio
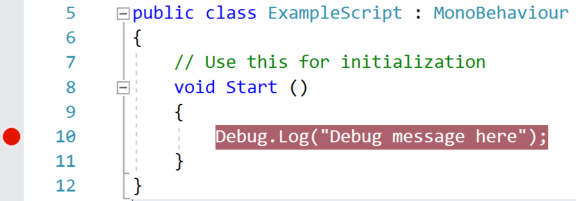
To set a breakpoint in Visual Studio, click on the column to the left of your code, on the line you want to stop the debugger. A red circle appears next to the line number and the line is highlighted.
Attach Visual Studio to the Unity Editor
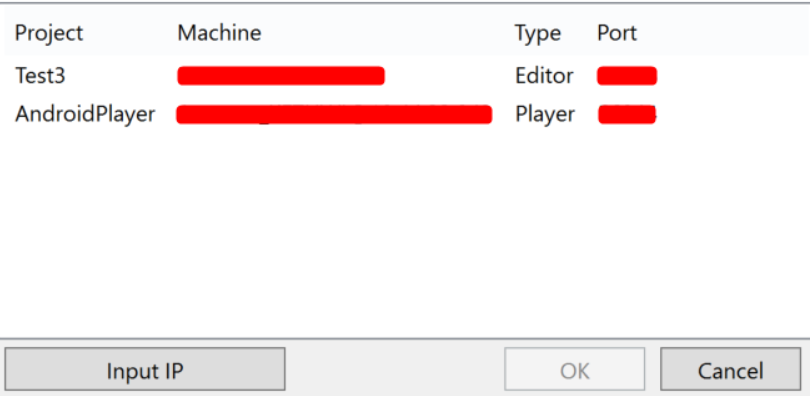
To attach the Unity Editor to your Visual Studio script, open Visual Studio, go to Debug > Attach Unity Debugger and select the instance of the Unity Editor you would like to debug.
In the following example image, there is one instance of Unity running in the Editor and one instance of Unity running as an Android Player
Debug Android and iOS devices with Visual Studio
Android
To debug a Unity Player running on an Android device, connect to the device using USB or TCP. For example, to connect to an Android device in Visual Studio, select Debug > Attach Unity Debugger option. A list of devices running a Player instance appears.
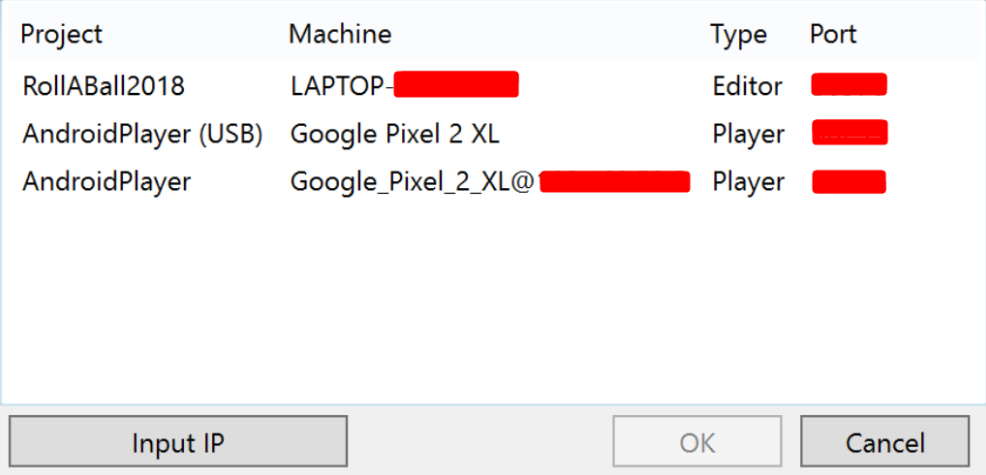
In this example, the android device is connected using USB and Wi-Fi on the same network as the workstation running the Unity Editor and Visual Studio.
Chrome OS 上的 Android
Unity can’t automatically discover Chrome OS devices. To initiate a connection, connect to the device through Android Debug Bridge (adb). For more information about how to use adb, see the Android Studio User Guide.
iOS
To debug a Unity Player running on an iOS device, connect to the device using TCP. For example, to connect to an iOS device in Visual Studio for Mac, select Debug > Attach Unity Debugger. A list of devices running a Player instance appears.
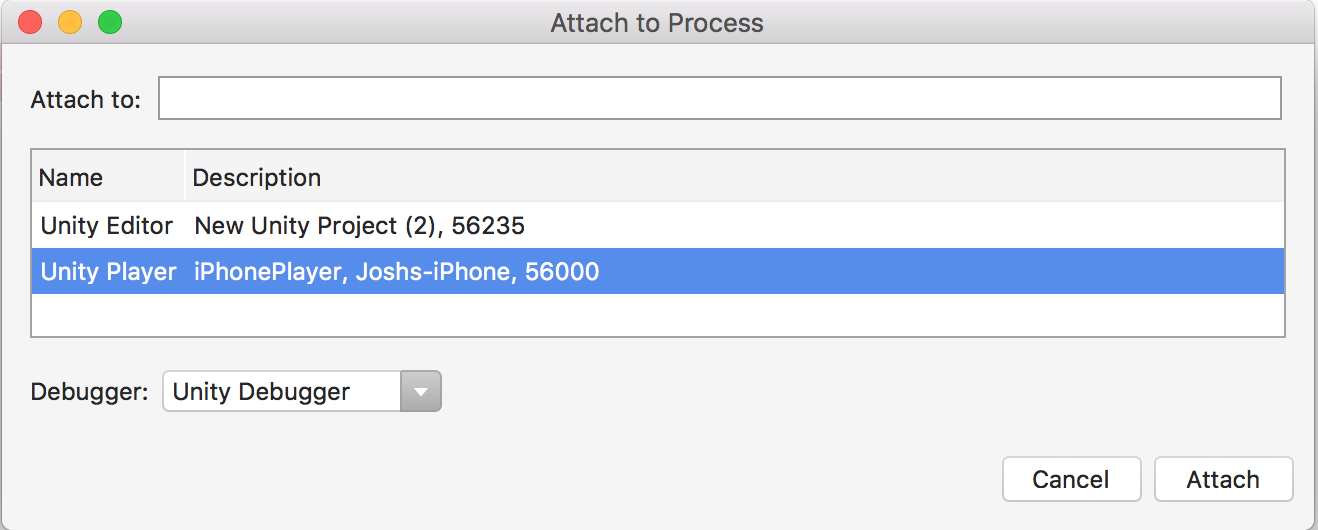
Ensure that the device only has one active network interface (Wi-Fi recommended, turn off cellular data) and that there is no firewall between the IDE and the device blocking the TCP port (port number 56000 in the above screenshot).
Important: iOS does not support debugging over USB.
Troubleshoot the debugger
Most problems with the debugger occur because the code editor is unable to locate the Unity Editor or the Unity Player. This means that the Unity Editor or Player can’t attach the debugger properly. Because the debugger uses a TCP connection to the Editor or Player, connection issues are often caused by the network. Below are a few steps you can take to troubleshoot basic connection issues.
确保将调试器连接到正确的 Unity 实例
You can attach your code editor to any instance of the Unity Editor or Unity Player on the local network that has debugging enabled. When you attach the debugger, ensure that you attach it to the correct Unity instance. If you know the IP address or machine name of the device on which you are running the Unity Player, this helps to locate the correct instance.
验证与 Unity 实例的网络连接
The code editor uses the same mechanism to locate a Unity instance to debug as the Unity Profiler. If the code editor can’t find the Unity instance you expect, try to attach the Unity Profiler to that instance. If the Unity Profiler cannot find the Unity instance either, there might be a firewall on the machine you are running the code editor or Unity instance on. If a firewall is in place, see Check the firewall settings.
Ensure the device only has one active network interface
Many devices have multiple network interfaces. For example, a mobile phone might have both an active cellular connection and an active Wi-Fi connection. To properly connect the debugger to the Unity instance using TCP, the IDE needs to make a network connection to the correct interface on the device. If you plan to debug over Wi-Fi, for example, make sure you put the device in airplane mode to disable all other interfaces, then enable Wi-Fi.
You can determine which IP address the Unity Player tells the IDE to use by looking in the Player Log. Look for a part of the log like this:
Multi-casting "[IP] 10.0.1.152 [Port] 55000 [Flags] 3 [Guid] 2575380029 [EditorId] 4264788666 [Version] 1048832 [Id] iPhonePlayer(Example-iPhone):56000 [Debug] 1 [PackageName] iPhonePlayer" to [225.0.0.222:54997]...
此消息表明 IDE 将尝试使用 IP 地址 10.0.1.152 和端口 56000 来连接到设备。运行 IDE 的计算机必须能访问此 IP 地址和端口。
Check the firewall settings
The Unity instance communicates with the code editor using a TCP connection. On most Unity platforms, this TCP connection occurs on an arbitrarily chosen port. Normally, you shouldn’t need to know this port, as the code editor should detect it automatically. If that doesn’t work, use a network analysis tool to determine which ports might be blocked either on the machine where you are running the code editor, or the machine or device where you are running the Unity instance. When you find the ports, make sure that your firewall allows access to the port on both the machine running the code editor, and the machine running the Unity instance.
验证托管调试信息是否可用
If the debugger attaches to the Unity instance but breakpoints don’t load, the debugger might not be able to locate the managed debugging information for the code. Managed code debugging information is stored in files named .pdb, next to the managed assembly (.dll file) on the disk.
When you enable the correct preferences and build options (see Configure the code editor), Unity generates this debugging information automatically. However, Unity cannot generate debugging information for managed plugins in your project. You can only debug code from managed plugins if the associated .pdb files are next to the managed plugins in the Unity project on disk.
防止设备锁定
Disable any screen locks on the device you are using to debug your application. Screen locks cause the debugger to disconnect, and prevent it from re-connecting. Don’t lock the screen during managed code debugging. If the screen locks, restart the application on the device so the debugger can connect again.
Code editor external documentation
- Visual Studio - Using Visual Studio Tools for Unity (Windows)
- Visual Studio for Mac - Using Visual Studio Tools for Unity (macOS)
- Jetbrains Rider - Debug Unity Applications